


Published by: Élodie Maurel-Lescure — Editor specializing in various
In a changing business environment, hierarchical clarity is an operational necessity. Lonline organizational chart is the agile solution to visualize power relations, communication flows and responsibilities. Unlike static versions on paper or PDF, these interactive tools allow instant updating and smooth collaboration between departments.
Contents
Why abandon static software for the cloud?
The manual update of an employee departure on PowerPoint is a waste of time. Moving to an online tool transforms the management of your human capital into a dynamic process.
Real-time collaboration
The ability of several administrators to work simultaneously on the same document is a major benefit. While HR adjusts recruitment, management validates reporting lines. The collaboration in real time eliminates conflicting versions that often pollute internal servers.
Data interoperability and import
Modern tools connect to your existing databases. UsingCSV import or direct integration with SIRH software, you generate a complex structure in seconds. This automation reduces input errors and ensures that the image reflects the reality of the field.
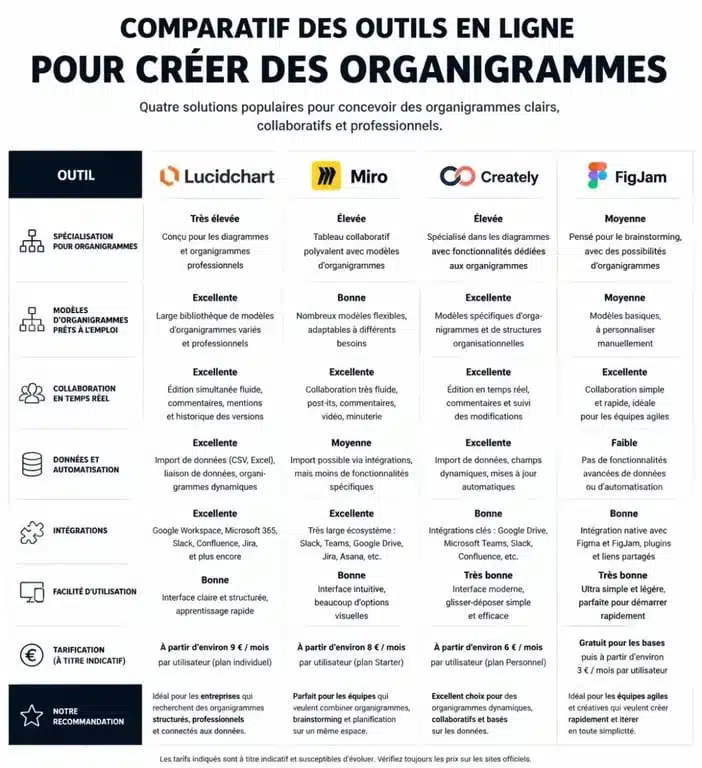
Comparison of the best online flowchart solutions
The choice of your platform depends on the size of your structure and your customization needs. Here is a comparative analysis of market leaders.
| Tool | Strong Points | Target audience | Export format |
|---|---|---|---|
| Lucidchart | Excel/Google Sheets Data Link | SMEs and large enterprises | PDF, PNG, SVG |
| Miro | Infinite whiteboard and flexibility | Agile and Creative Teams | Image, PDF |
| Creately | Intelligent connectors and pro-themes | Managers and HR | SVG, JPEG |
| FigJam | Extreme simplicity and free of charge | Startups and Tech | PNG, SVG |
The choice must focus on the capacity of the tool to manage growth. A software that becomes unreadable beyond 50 employees loses its interest. Focus on solutions offering clustering or zooming functions to maintain readability.
The secret of a legible organizational chart
Creating an organization chart is an information design exercise that must serve the company's strategy. It's not just about connecting boxes with lines.
Visual standardization
So that online organizational chart be effective, adhere to strict visual codes. Use a color palette coherent: a color for management, one for support functions, and one for operations. The intelligent connectors shall remain perpendicular to avoid the effect « spider web » which makes reading painful.
The flow of information is not always vertical. To translate transversality, some tools can add dotted lines or areas of collaboration. This identifies who works with whom on specific missions, offering an organic vision of the company.
The importance of metadata
A good interactive flowchart allows you to click on a team member to display additional information: job form, skills, link to the LinkedIn profile or email address. This depth of information transforms a schema into a real dynamic business directory.
Practical guide: Create your structure in 4 steps
If you leave a blank page, follow this methodology to obtain a professional result.
Collect your data first by listing employees, their positions and their direct superiors in an Excel file. Then select a flowchart template adapted to your type of management, whether hierarchical, matrix or flat. Then use the import function of your tool to generate the basic structure. Finally, adjust spacings, apply your graphic chart and check the consistency of subordination links.
Once completed, share the document via a secure link or integrate it directly into your intranet. Most solutions offer dedicated widget for fluid visualization without leaving your usual workspace.
Avoid classic hierarchical visualization traps
The main risk of too complex an organizational chart is to become obsolete as soon as it is published. Limit the level of detail visible by default. It is preferable to have several views, such as a global view of direction and detailed views by service, rather than a huge unreadable poster.
Make sure the platform meets GDPR standards, especially if you include photos or personal contact information. The secure sharing options with password access or via SSO authentication are essential selection criteria for IT services.
Updated on 23 June 2026